
Browse and filter events
Browse the event log with pagination, filter events by date range, type, or user, and view detailed metadata for each entry.
The event log table shows the most recent events first, with pagination to browse older events (30 events per page). Go to Administration > Event log to open it.
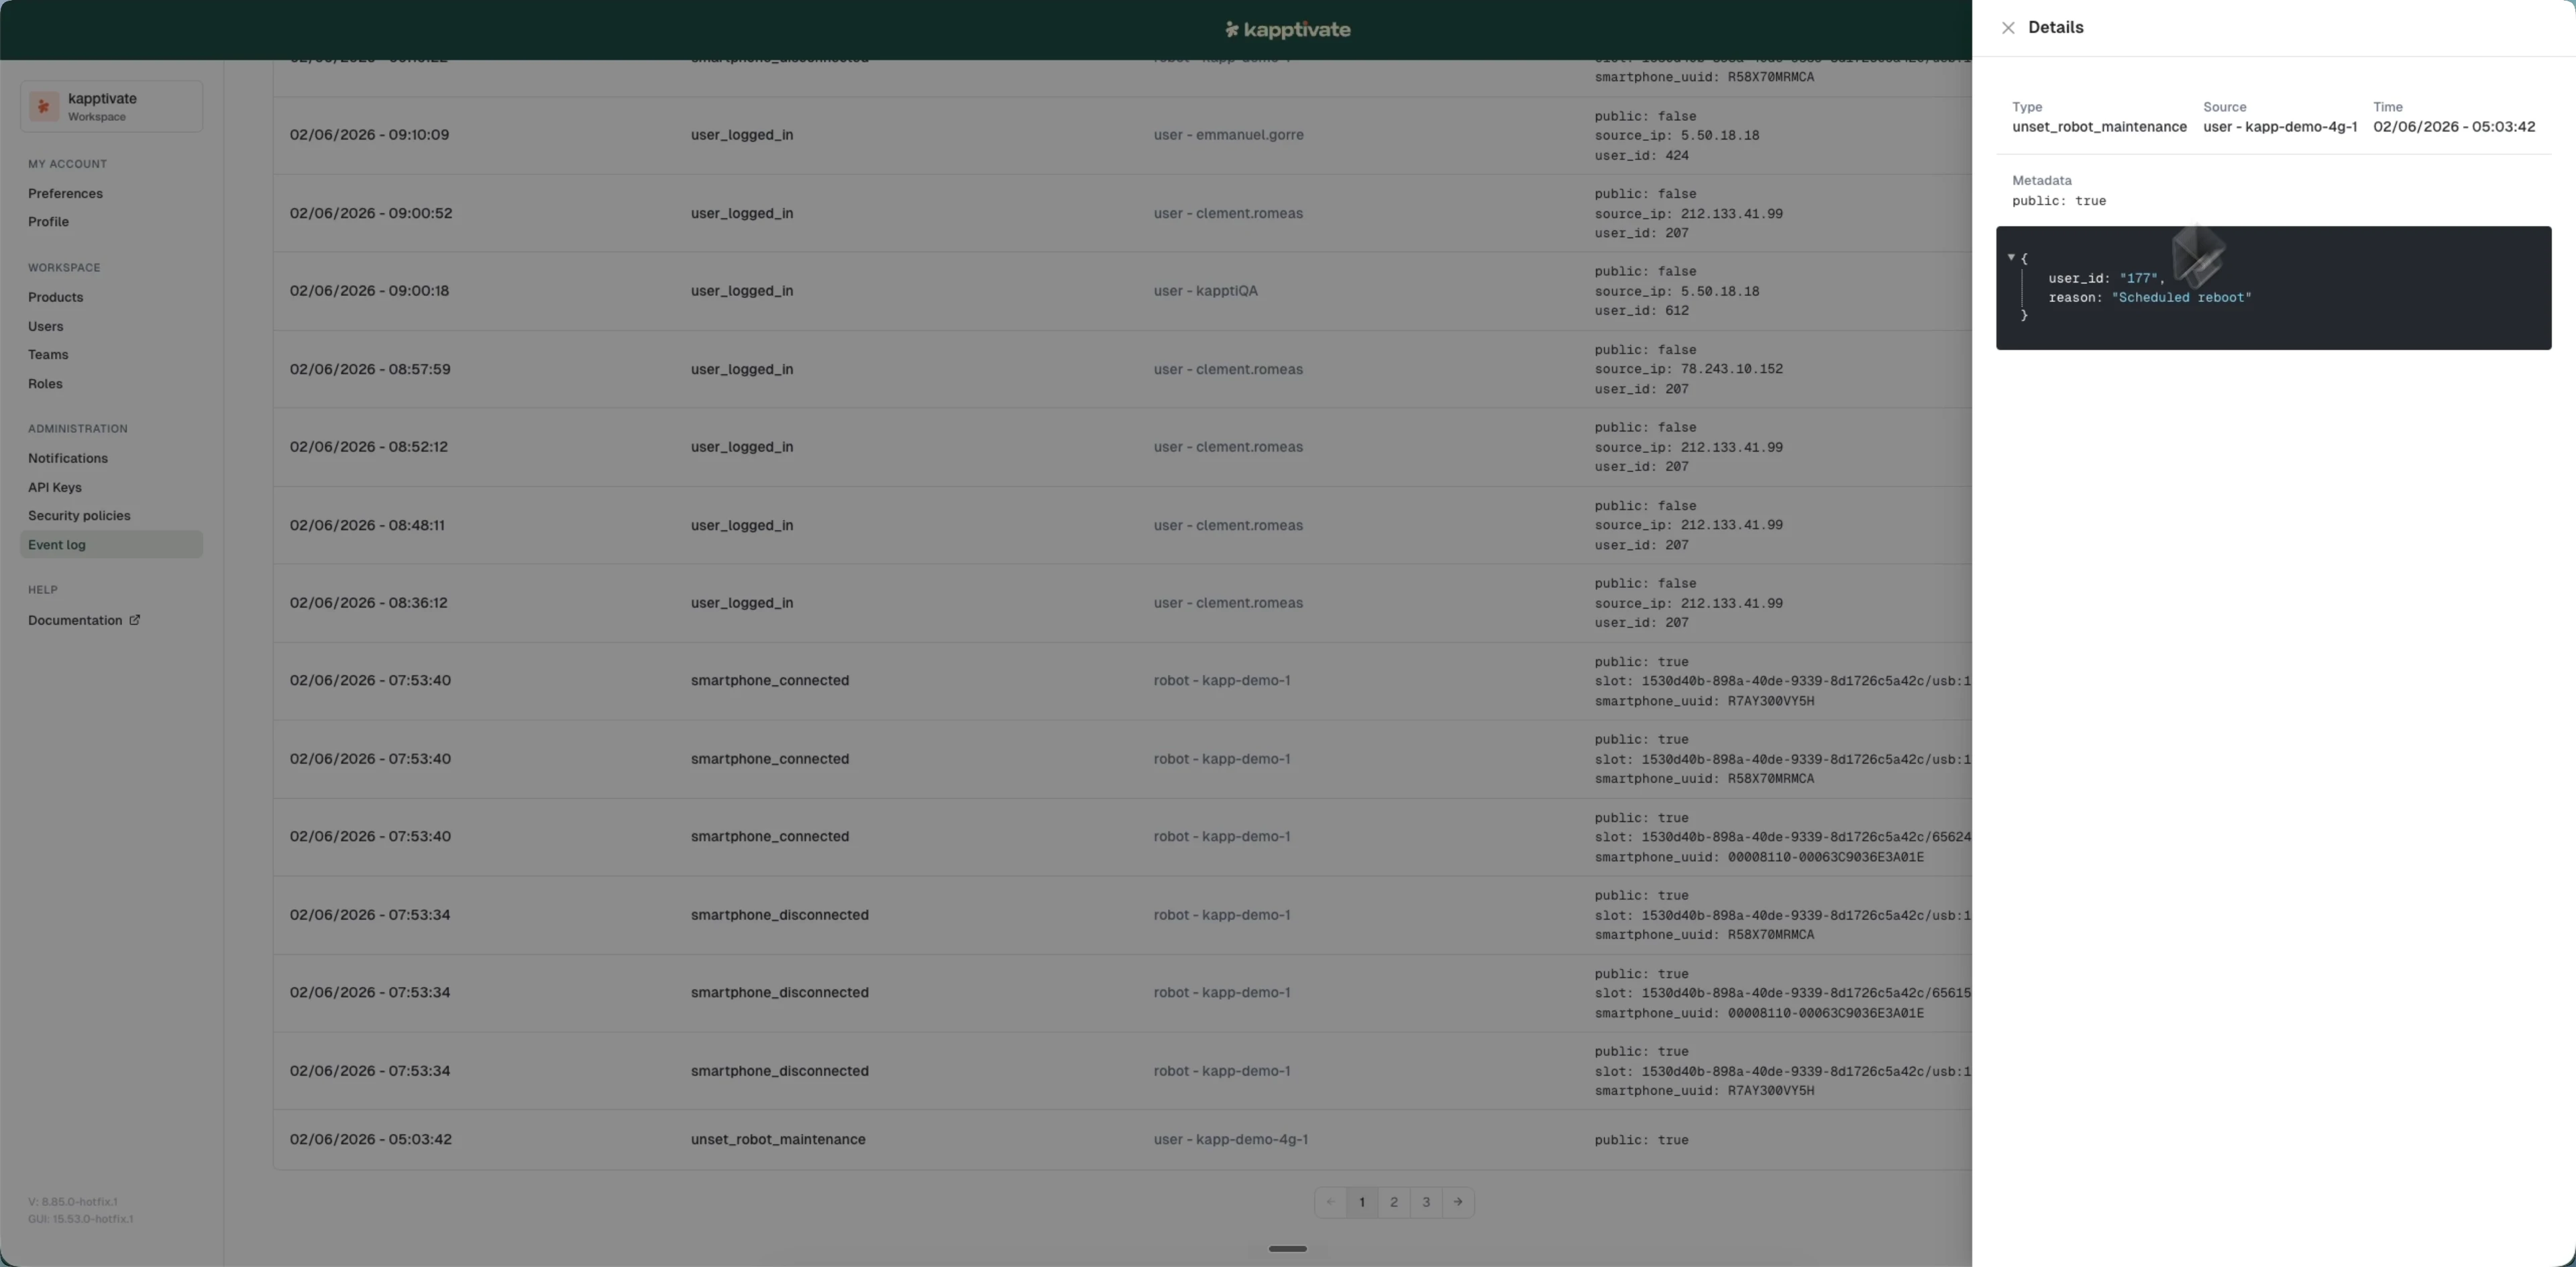
Event columns
Each event displays:
- Time: When the event occurred (formatted in your selected timezone)
- Type: The kind of event (e.g.,
user_logged_in,smartphone_connected,service_credentials_created) - Source: What triggered the event (e.g., "user@example.com" or a specific resource)
- Metadata: Additional details about the event (on large screens shown inline; on smaller screens, click "View More")
Filter events by date
Two controls at the top right narrow results to a time period. Pick a quick range for common windows, or set an exact range with the date picker.
The quick-range dropdown covers the most common windows: Past 1h, 2h, 6h, 12h, 24h, or 48h, plus Today, Yesterday, Last 7 days, and Last 30 days.
For an exact window, use the date range field next to it:
- Click the date range field
- Select a start date and an end date
- The table updates automatically
All dates are displayed in the timezone you select in the date picker. Your timezone choice is saved in your browser.
Filter by event type
Use the Type dropdown filter to show only specific kinds of events (e.g., only login events). Select one or multiple types, or leave blank to show all types.
Filter by user
Use the User dropdown filter to show only events triggered by a specific user. Select one or multiple users, or leave blank to show all users.
Filters can be combined. For example, filter by type "user_login" and user "john@example.com" to see when that user last logged in.
View event details
Events may display additional metadata inline. For complete details, click the event row (or its View More button on smaller screens) to open the Details panel.
The panel shows:
- Type: The event type
- Source: Full source information
- Time: The formatted event timestamp
- Metadata: The complete event data, with structured payloads shown as formatted JSON
Click the close button to dismiss the panel.
Last updated on