
Alerts: raise an incident from monitor results
Configure threshold, success rate, and raw alerts on monitoring data to trigger incidents and notify your team via email, Slack, or webhooks.
Monitors produce a stream of results; alerts decide which of them deserve your attention. An alert watches monitoring data, raises an incident when its conditions are met, and notifies your team through the channels you choose. You manage them on the Alerts tab of the Incidents area.
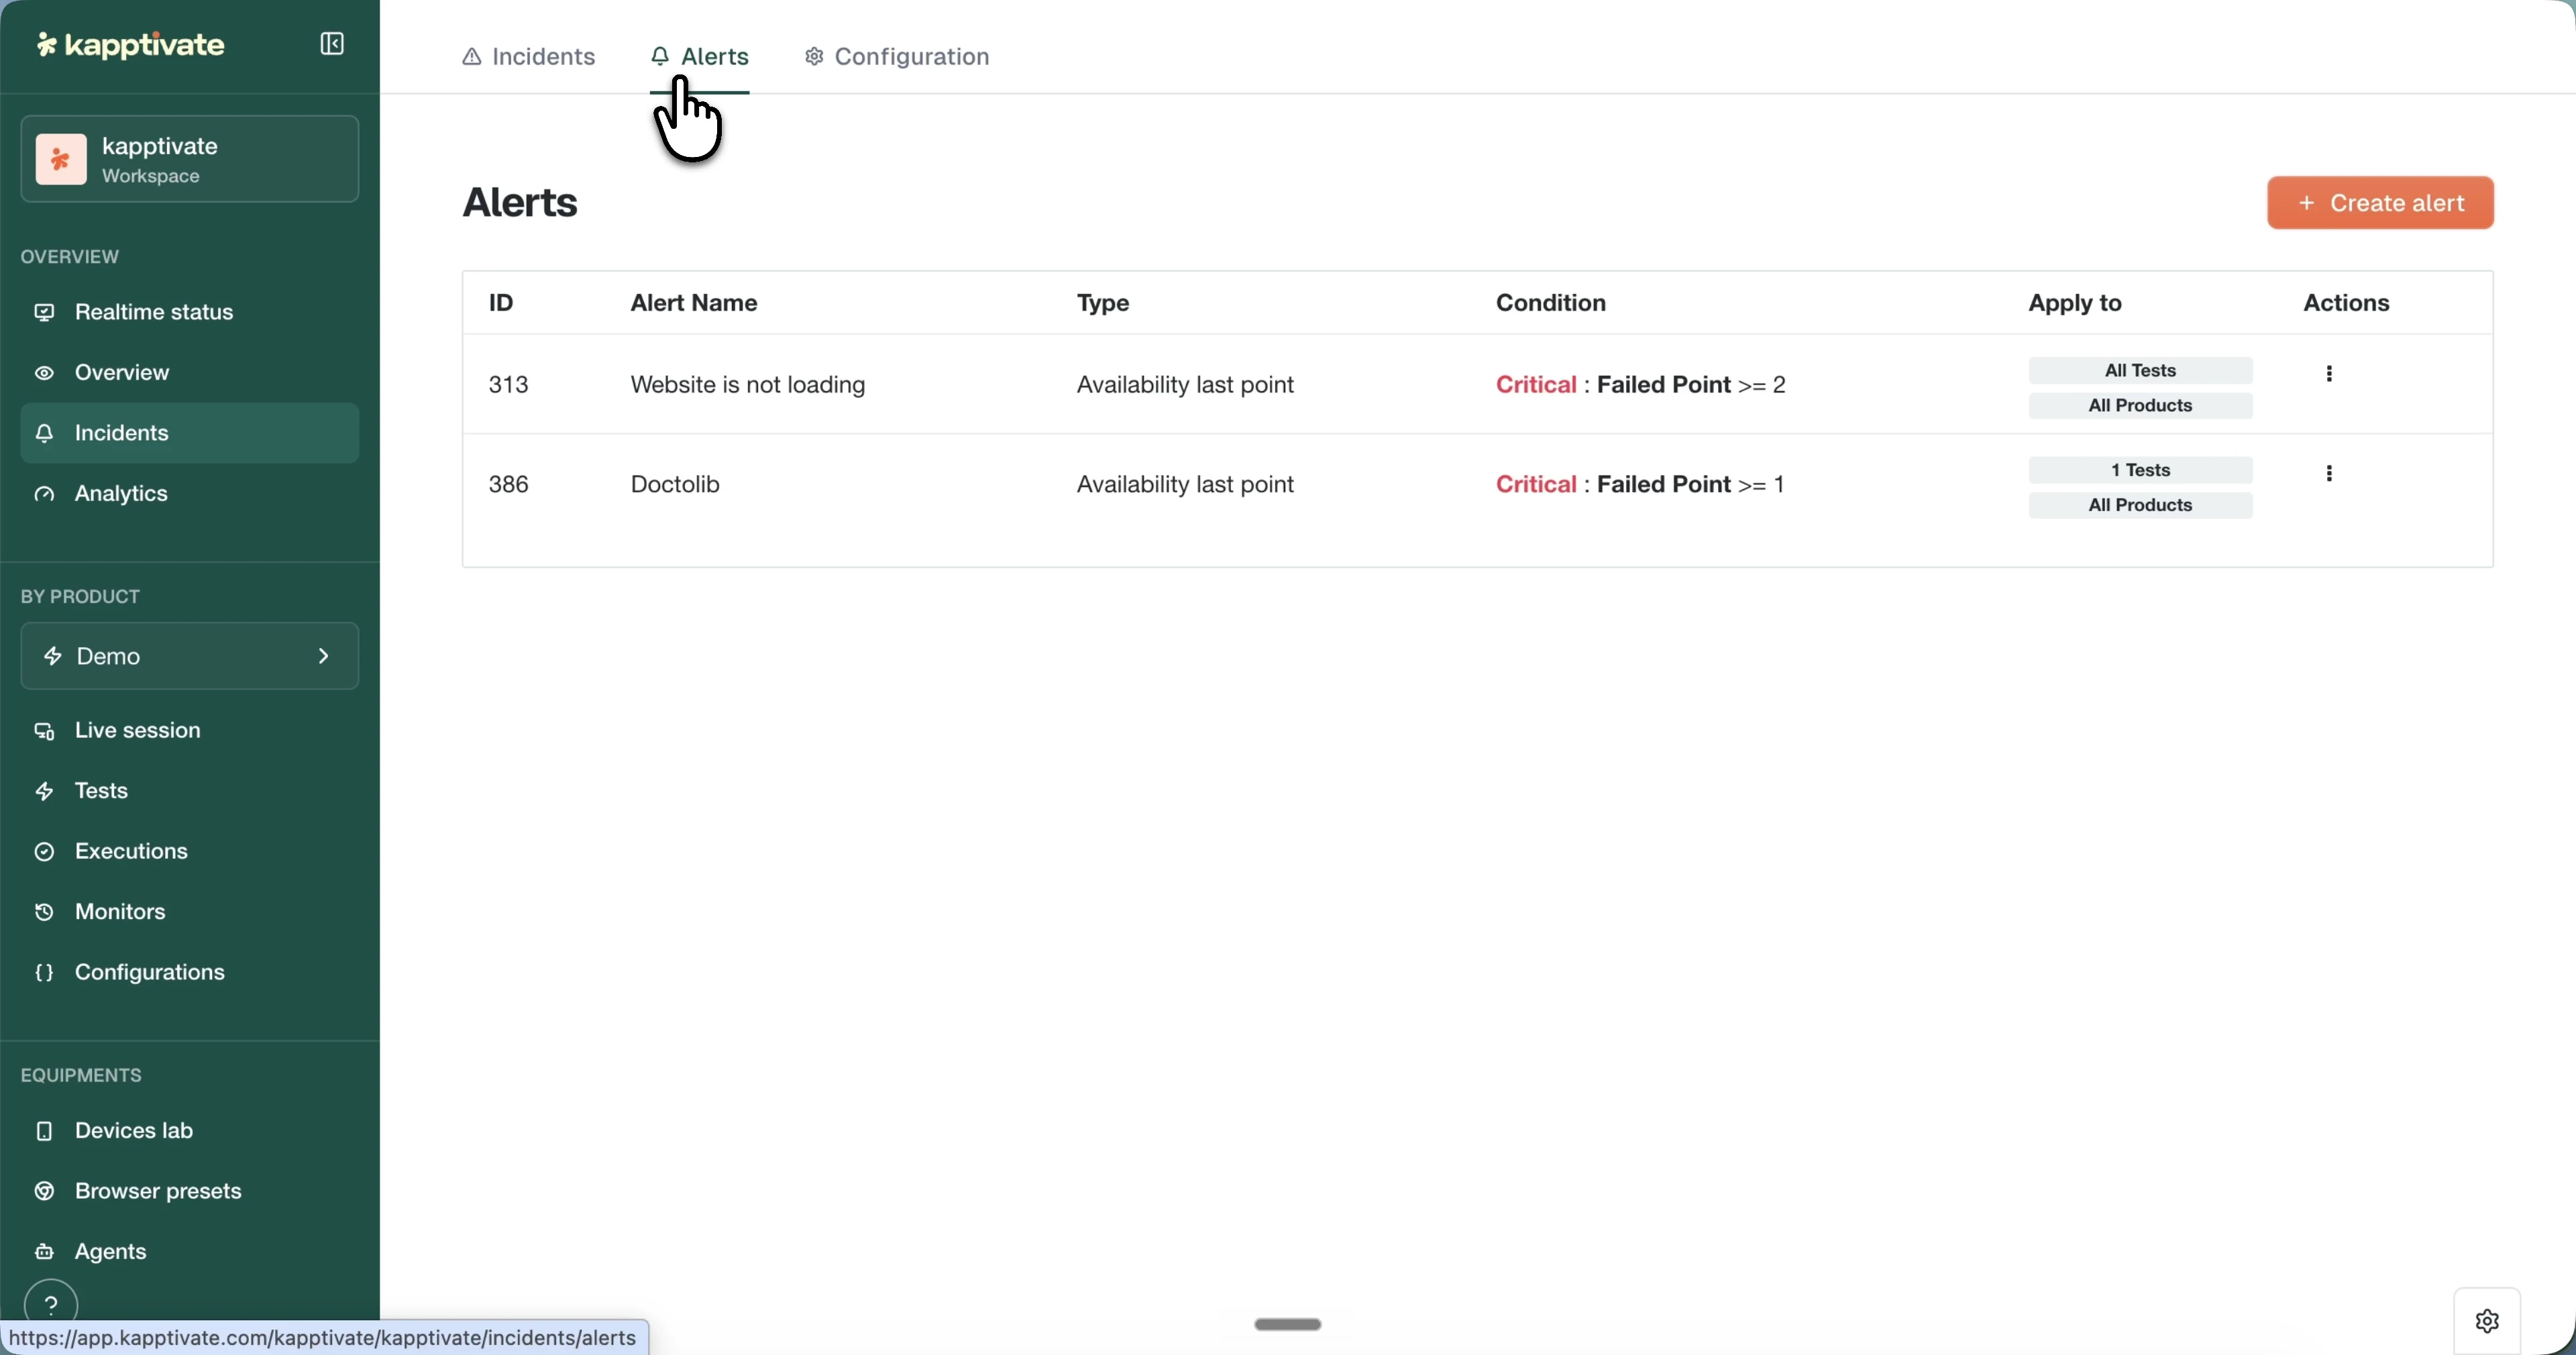
Alerts list
The list shows every alert configured in the workspace, so you can audit what's being watched and at which thresholds. Each row shows:
- ID and Alert Name.
- Type: the alert template, such as "Availability last point".
- Condition: the trigger rule, for example "Critical: Failed Point >= 2".
- Apply to: the scope, as tags like "All Tests" and "All Products" or specific ones.
- Actions: a menu to edit or delete the alert.
Alert types
Click Create alert to pick a template. The type determines what the alert evaluates:
- Threshold alerts trigger when a metric fails to satisfy conditions over time. For example: "alert me if the USSD response time stays above 60 seconds over the last 5 minutes".
- Success rate alerts over the last runs trigger when failures exceed a threshold over recent executions. For example: "alert me if a test failed more than 3 times over the last 5 runs".
- Raw alerts run a custom in-house alerting script, for edge cases the other templates don't cover.
Threshold alerts
A threshold alert watches a metric and fires when it crosses the limits you set. Configuration starts with the Alert Source, which defines exactly which data to evaluate:
- Bucket: the data bucket to read from, such as "default - duration (forever)".
- Measurement: the metric series, such as
ethernet_http_api,cellular_http_download, orbrowsing_performance. - Filtered by: optional filters to narrow the series.
- Select: the aggregation function applied to the values, such as
mean (http_call_duration_seconds). - Grouped by: optional grouping of the series.
Once a metric is selected, a line chart plots its recent history so you can set thresholds against real data; hover a point to see its timestamp and value. Below the chart, Alert Conditions define when to fire:
- Time window: a rolling period, such as "Over the last 5 minutes".
- Operator: how the value is compared, with "above or equal", "strictly above", "below or equal", or "strictly below".
- Warning Threshold and Critical Threshold: the two trigger levels, drawn on the chart as yellow and red reference lines as you type them.
Success rate alerts
A success rate alert counts failures over the most recent executions instead of watching a metric, which makes it the natural fit for "this test keeps failing" situations. Its source is locked to Failed Point; you configure:
- Last points to check: how many recent executions to evaluate, for example 10.
- Include technical error: whether technical errors count as failures.
- Warning and Critical: how many of those points must have failed to reach each severity. Untick the box next to Warning to skip that level and only raise critical alerts.
By default the alert applies to all your active monitorings. Use Restrictions to scope it to specific Products, Variable groups, or Tests instead.
Notifications
Each alert carries its own notification settings, so a critical production alert can page the on-duty channel while a low-stakes one just emails a mailbox. At the bottom of the alert form:
- Recurrence: enable "Send a notification every N minutes until the alert is closed" to keep reminding the team while the incident is open, for example every 15 minutes.
- Email notification: select the users to notify.
- Slack notification: paste a Slack webhook link.
- Microsoft Teams notification: paste a Teams webhook link.
- Webhook notification: POST to a custom endpoint, with optional custom HTTP headers.
Click Save to apply, or Clear Values to reset the form.
These notifications are per alert. For workspace-wide alerts when a robot goes offline, see Notifications under Administration.
Error exclusions
Some errors are expected: a planned maintenance message, a known harmless failure. Error exclusions keep them from raising alerts, so only meaningful issues generate incidents and notifications.
On the Configuration tab, open Error exclusions and click Create error exclusion. Enter a text snippet in If pattern contains: any error whose message matches the pattern is ignored.
Last updated on