
Monitors overview
Manage and monitor automated tests with the monitors list, tracking health, run history, scheduling, and device status in real time.
A Monitor is an automated test promoted from the Tests workspace to continuous production supervision. Monitors run on a recurring schedule with real-time status tracking and alert capability. Use the monitors list to view all monitors, their health, and recent execution results.
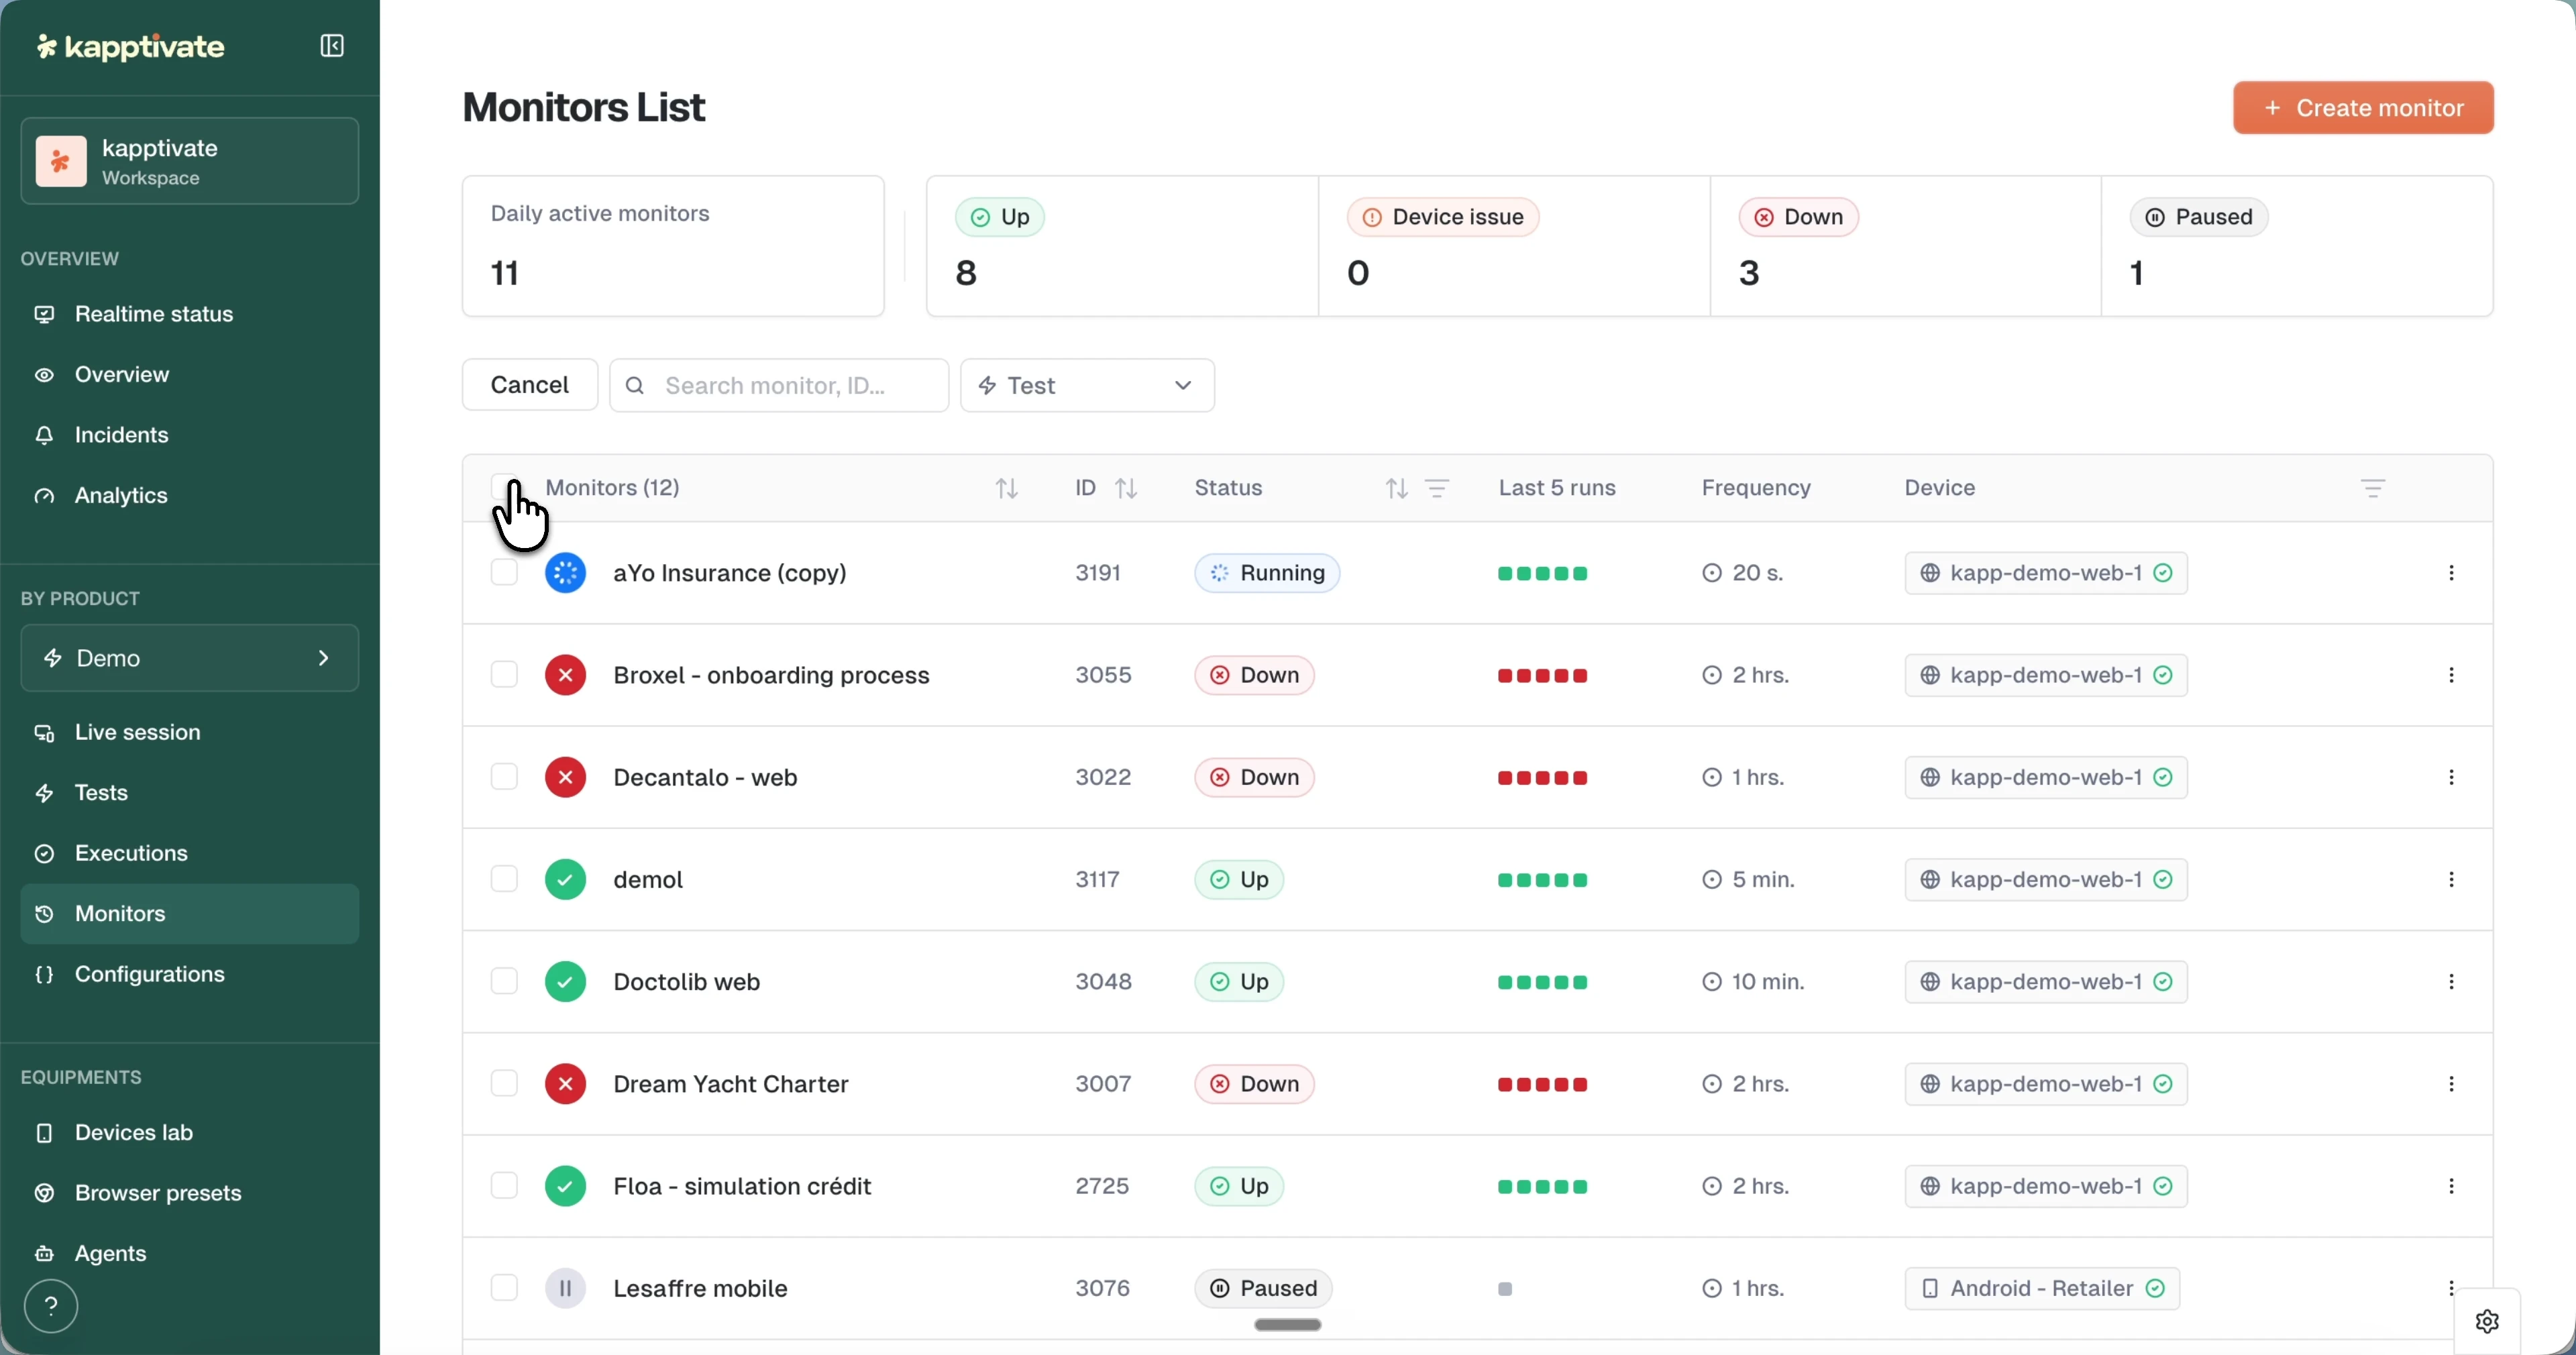
The monitors list
The monitors list shows every monitor in your Product. Each row displays the monitor's ID, Status, Last 5 runs, Frequency, and Device; hover a device chip to see its host machine and browser version. Search by monitor name or ID, or filter by test.
From the list, you can run a monitor immediately, pause or resume it, edit its configuration, or duplicate it. Use multi-select to pause, resume, update scheduling, change devices, or delete multiple monitors at once.
Health summary cards
Counter cards at the top of the monitors list provide an instant health snapshot:
| Card | What it shows |
|---|---|
| Daily active monitors | Total monitors with active status (not paused) |
| Up | Monitors whose last execution succeeded |
| Device issue | Monitors with unavailable or misconfigured devices |
| Down | Monitors whose last execution failed |
| Paused | Monitors currently paused and not running |
Monitor statuses
Each monitor displays a single status that reflects its health and activity state:
| Status | Meaning |
|---|---|
| up | Monitor is active and the last execution succeeded |
| degraded | Monitor is active but the last execution had warnings or minor issues |
| down | Monitor is active and the last execution failed |
| paused | Monitor is paused (inactive) and not executing on its schedule |
| running | Monitor is currently executing a test |
| scheduled | Monitor is active and waiting for its next scheduled execution |
Last 5 runs
The Last 5 runs column shows the most recent executions as colored squares, green for success and red for failure. Click a square to open the "Monitoring results" modal: it shows the run's outcome, its Steps (with durations) and Video tabs, plus Open details to jump to the full result and Edit related test to fix the scenario.
Row actions
Each monitor row has a three-dot menu with these actions:
| Action | What it does |
|---|---|
| View analytics | Open the monitor's detail page to view analytics and execution history |
| Edit monitor | Open the form to edit the monitor's name, devices, scheduling, and options |
| Duplicate | Clone the monitor; you can rename it and reassign devices before saving |
| Edit related test | Navigate to the test this monitor is based on |
| Edit frequency | Change the monitor's schedule without editing the full form |
| Edit device | Change the assigned device (only available for monitors with a single device) |
| Pause / Unpause | Temporarily disable or re-enable the monitor |
| Force run | Execute the monitor immediately, regardless of its schedule |
| Activate test-only mode | Suspend the automated schedule while still allowing manual triggers from the UI or CI/CD |
To delete monitors, use multi-select and the bulk actions banner.
Bulk actions
Enable multi-select mode and check the monitors you want to act on. A banner appears at the bottom with these actions:
- Edit Frequency: update the schedule for all selected monitors at once
- Edit Device: change the assigned device (only if all selected monitors use exactly one device each of the same type)
- Pause: pause all selected monitors
- Unpause: resume all selected monitors
- Delete: remove all selected monitors
What's next?
Last updated on