
Custom dashboards and widgets
Create, organize, and share custom Kapptivate dashboards with widgets, collections, and secure public links for any audience.
The same monitoring data answers different questions for different people: an executive wants a weekly service health view, an engineer wants error counts per test. Dashboards let you compose exactly the view each audience needs and keep it one click away. They live in the Analytics area, alongside tests metrics, email reports, and exports.
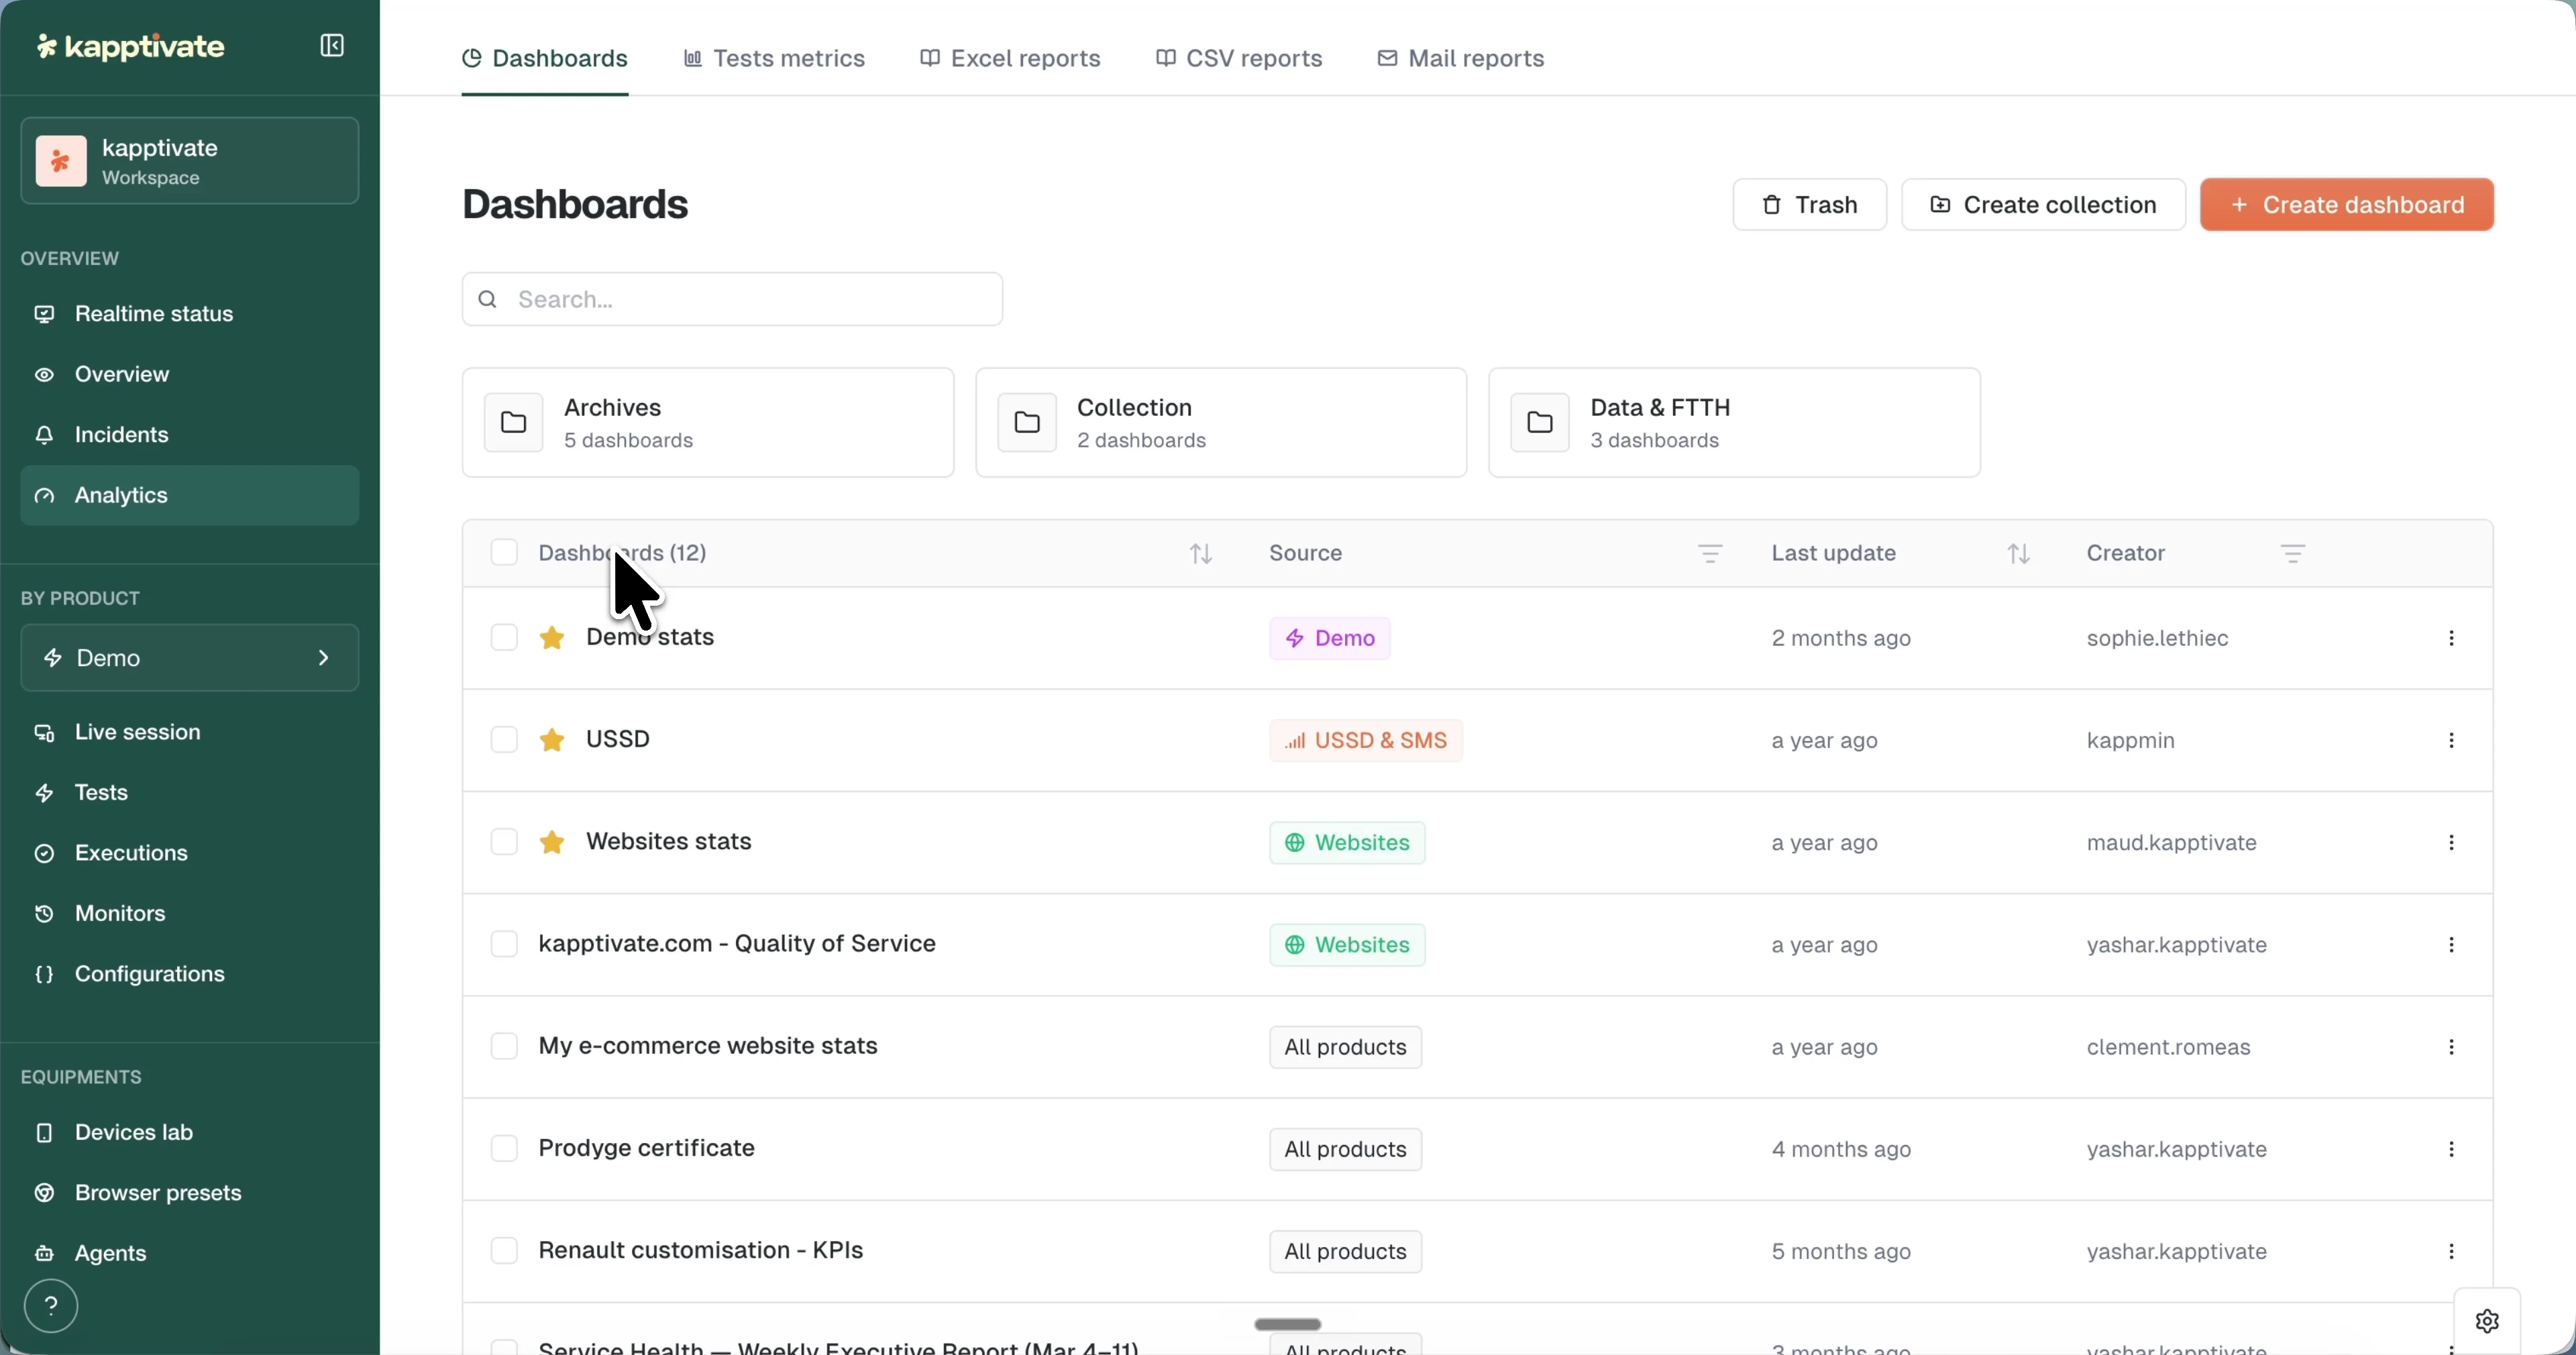
The dashboards list
The Dashboards tab lists every dashboard in the workspace:
- Name, with a star to mark favorites; favorites sort to the top and are saved in your preferences.
- Source: colored tags showing which products feed the dashboard (or "All products").
- Last update: when it was last modified, as a relative time.
- Creator: who owns it.
Search dashboards by name with the search bar. Collection folders sit above the list, with Trash, Create collection, and + Create dashboard in the top right.
Organize with collections
Collections are folders that group related dashboards by team, project, or purpose. Click Create collection to add one, open a folder card to browse it, and use Move dashboard from a row's menu to file a dashboard into a collection.
Deleted dashboards go to the Trash collection, where they can be restored or permanently deleted.
Row actions
Each dashboard row has a menu with:
- Edit: open the dashboard in edit mode.
- Put in favorites / Remove from favorites: toggle the star.
- Lock: prevent accidental edits; locked dashboards show a lock icon.
- Duplicate: copy the dashboard as a starting point.
- Move dashboard: file it into a collection.
- Share public link: open the sharing dialog.
- Delete: move it to the trash.
Create a dashboard
If you only need per-monitor analytics, Tests metrics already provides a ready-made dashboard for every monitor, with no setup.
Click + Create dashboard, then give it a Dashboard name and select the Bucket that supplies its data. Open Options for advanced settings, then click Add.
The dashboard opens in edit mode, where you compose it from widgets:
- Widget types: Title, Counter, Pie, Area range, Line / Bar, Percentage area, Histogram, Table, and Custom Display, all available from the toolbar.
- Edit-mode bar: set the aggregation interval, timezone, and time range (for example "Past 48h (Realtime)"), toggle the legend, then Save or Cancel.
- Variables: create text fields, dropdowns, or multi-select lists so viewers can filter the data dynamically; every widget using a variable updates when its value changes.
Share a dashboard
Share a dashboard with people who don't have a Kapptivate account. Choose Share public link from the row menu:
- Public link: set a password (at least 8 characters, required), then click Generate share link and send the link yourself.
- Send by email: enter the recipient's address and the password, and Kapptivate sends the protected link directly.
Visitors get a read-only view; see Public dashboards for what they can and can't do.
Last updated on