
Tests metrics
Access ready-made analytics dashboards for every monitored test, tracking success rate, error types, and step-by-step performance instantly.
Building a dashboard per test by hand wouldn't scale. The Tests metrics tab in the Analytics area gives you a ready-made analytics view for every monitor on the platform, with no setup: as soon as a test is monitored, its metrics dashboard exists.
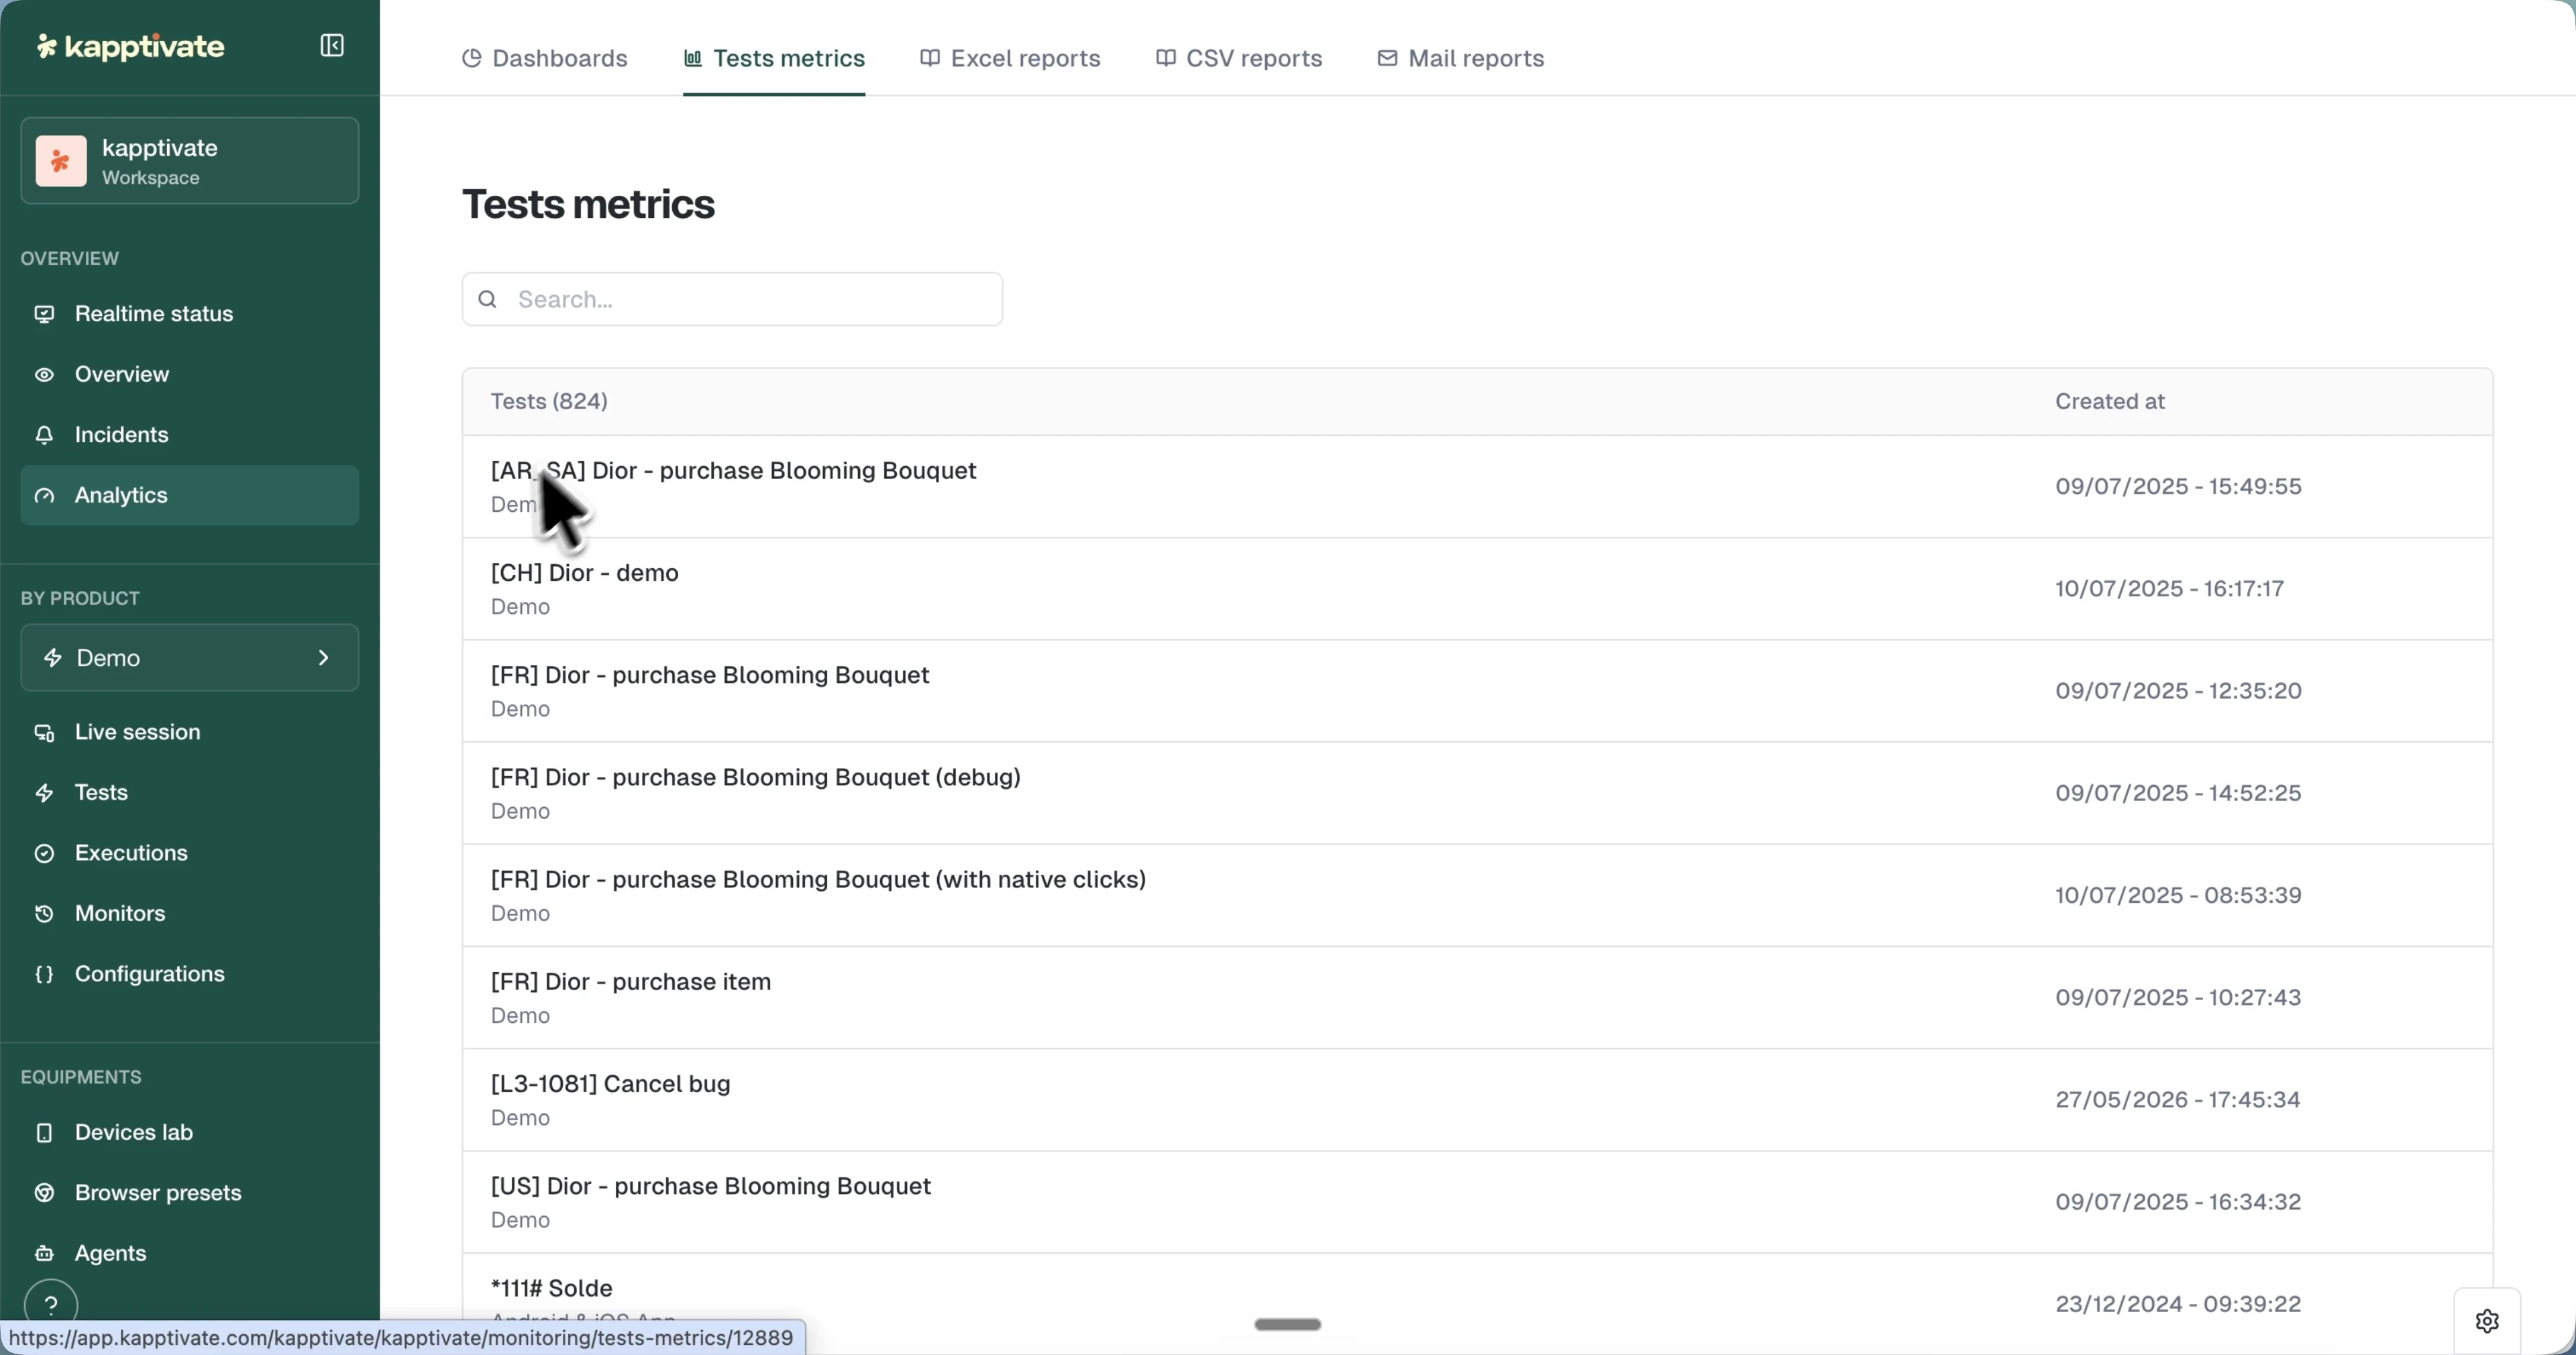
Browse tests metrics
The tab lists every monitored test with its name, product, and creation date. Use the search bar to find a test by name, and click it to open its metrics view.
The per-test view
Each test opens a predefined dashboard built from its execution data:
- Success rate: the proportion of successful and failed runs.
- Error type: the distribution of error categories.
- Global availability: success and failure over time.
- Error count over time: errors broken down by type.
- Step by step performances: how long each test step takes, device by device.
Use the top bar to adjust the aggregation interval, timezone, auto-refresh interval, and time range (for example "Past 48h (Realtime)").
For a custom view that combines several tests or other data sources, build a dashboard instead.
Last updated on