
Excel and CSV exports
Export monitoring data as aggregated Excel or raw CSV files, with configurable time ranges, products, and time groups.
Some analysis happens outside Kapptivate: a spreadsheet model, a BI tool, a data warehouse. The Excel reports and CSV reports tabs of the Analytics area generate downloadable extracts of your monitoring data, aggregated for Excel or raw for CSV.
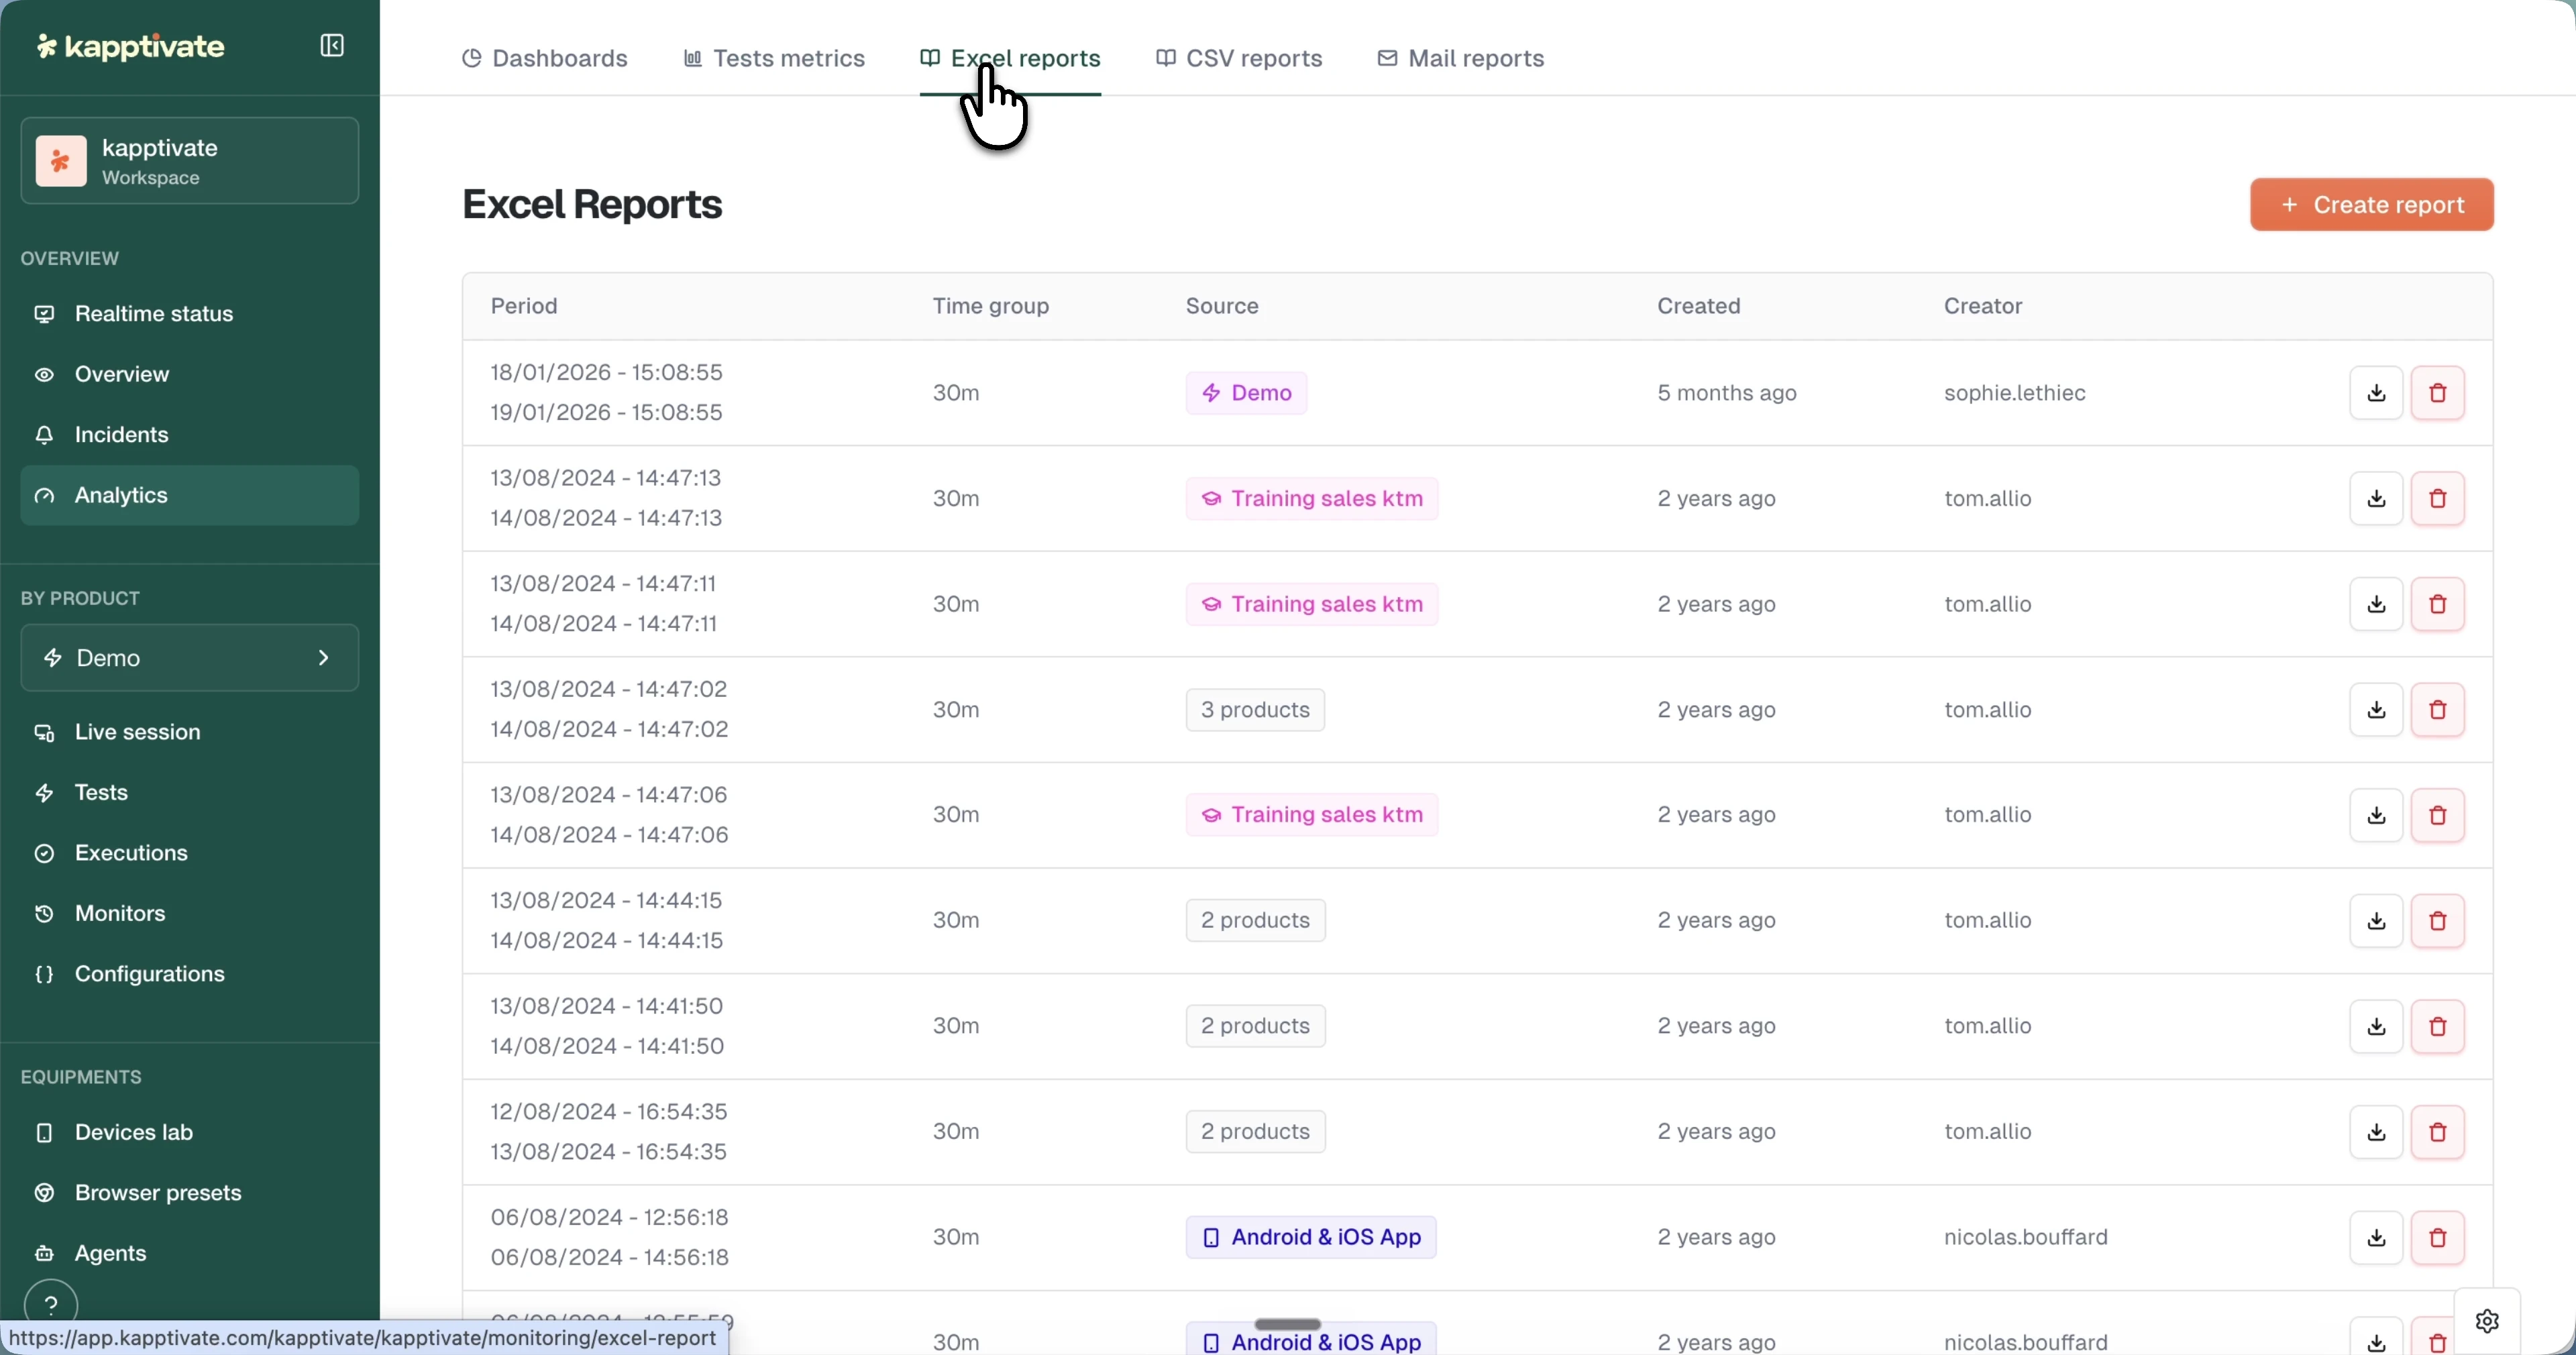
The exports list
Both tabs work the same way. Each generated export shows:
- Period: the date range it covers.
- Time group: the aggregation interval (Excel reports).
- Source: the products included, as tags (or a product count).
- Created and Creator.
- Actions: download the file again or delete it.
Exports stay available in the list until you delete them, so you can re-download a file without regenerating it.
Create an Excel report
Click + Create report on the Excel reports tab and configure:
- Time range: pick a preset (Past 1h, 2h, 6h, 12h, 24h, Today, Yesterday, Last 7 days, This week, Last 30 days) or set a custom start and end.
- Include all products: leave on for everything, or turn off to select specific products.
- Time group: the aggregation interval, as a number and unit (for example 30 minutes).
The file is aggregated by product and time period: each row holds a timestamp, the product, and its aggregated metrics for that interval.
Create a CSV export
Click + Create report on the CSV reports tab, pick the Time range, and choose whether to Include all products.
CSV exports contain the raw, unaggregated data points, which makes them the right format for feeding analysis tools or custom pipelines.
Last updated on